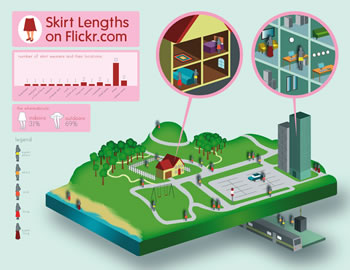


Infographics are great visual tools for communicating large amounts of data. Breaking down large amounts of abstract data, they place the information in context and transform it into tangible and useful knowledge. In this Illustrator tutorial we’re going to learn how to translate abstract data into a 3D, easy-to-understand illustration.
2,832 views